
Maximize returns: Understanding rental yields in Panama
Maximize returns: Understanding rental yields in Panama
- Panama Investors
- May 7
- 9 min read

Panama’s real estate market advertises gross rental yields that regularly catch investors’ attention, with figures floating around 7% or higher in popular neighborhoods. But those headline numbers rarely tell the full story. Once you subtract property management fees, insurance, maintenance, municipal taxes, and realistic vacancy periods, the actual return landing in your account looks quite different. This article breaks down the real math behind Panama rental yields, examines the market forces reshaping investor returns in 2026, and gives you a practical framework to evaluate properties before committing capital.
Table of Contents
Key Takeaways
Point | Details |
Net yield is what matters | Net yield factors all costs and vacancy, providing a realistic indicator of actual returns for Panama investors. |
Market cycle impacts returns | Yield potential fluctuates with local sales, transaction volumes, and credit trends—so timing and strategy are crucial. |
Expenses can narrow the gap | Property management, taxes, and occupancy rates in Panama can reduce gross yields by 1.5% to 2% on average. |
Diversify for stability | Combining yield-focused and appreciation-focused properties helps manage risk and optimize long-term returns. |
Expert guidance adds value | Working with Panama-focused advisors helps navigate real estate cycles, local costs, and property screening for maximum yield. |
What rental yield really means in Panama
Most new investors arrive in Panama having seen attractive gross yield figures in marketing materials or online listings. Gross yield is simply the annual rent divided by the property purchase price, expressed as a percentage. It is a useful starting point, but nothing more.
Net yield tells you what actually matters. It subtracts all recurring ownership costs from your annual rental income before dividing by property value. As net yield accuracy requires subtracting expenses including management, insurance, maintenance, taxes, and vacancy, the gap between gross and net is rarely trivial.
In Panama City, citywide averages tell an important story:
Metric | Average figure |
Gross rental yield | ~7.2% |
Net rental yield | ~4.7% |
Typical yield gap | ~2.5% |
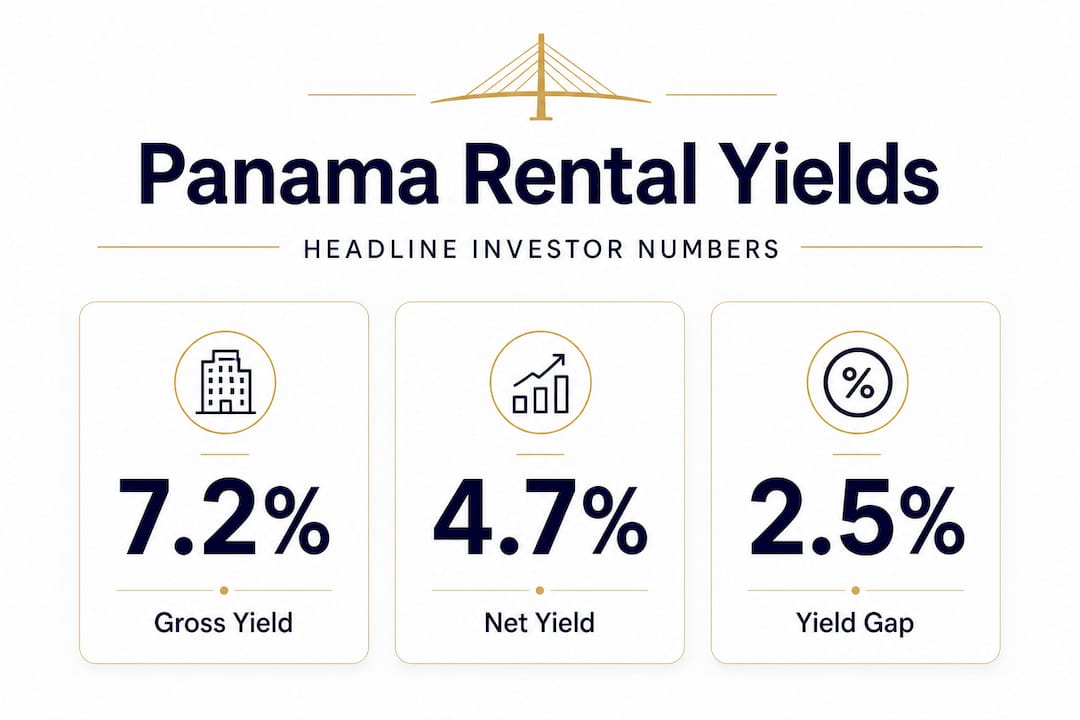
That 2.5 percentage point gap represents real money leaving your pocket every year. On a $250,000 property, the difference between 7.2% gross and 4.7% net equals roughly $6,250 annually in expenses that simply do not appear in the headline number.
The specific costs that create this gap include:
Property management fees: Typically 8% to 12% of monthly rental income for professional management
Insurance: Building and contents coverage adds up, particularly for condominiums in hurricane-adjacent zones
Maintenance and repairs: Budget 1% to 2% of property value annually for routine upkeep
Municipal and national taxes: Panama charges an annual property tax that varies by assessed value and use
Vacancy losses: Even in strong rental markets, assume 5% to 10% vacancy per year in your modeling
Understanding these figures before you buy is why reviewing Panama rental yield calculations in detail is a step serious investors never skip. Property type and location add another layer. A one-bedroom condo in Marbella may generate a different net yield than a two-bedroom unit in San Francisco district, even at comparable prices, simply because rental demand, tenant quality, and management costs differ by neighborhood.
Pro Tip: Always request a formal operating cost breakdown from any property manager or real estate advisor before accepting a quoted gross yield. Ask specifically: what does net yield look like after all recurring costs over a 12-month period?
Factors affecting rental yields for international investors
With yields clearly defined, next we need to examine the real-world factors that change net outcomes for investors. International buyers face a specific set of cost and tax considerations that local Panamanian investors may not deal with in the same way.
The gross-to-net gap can be meaningful in Panama due to recurring ownership costs and real-world vacancy, so underwriting should include them explicitly. Here is what this looks like in practice for a foreign investor:
Recurring costs to model every year:
Property management: Essential for investors not living in Panama full time
Insurance premiums: Including liability coverage that many international investors overlook
Routine repairs: Plumbing, air conditioning servicing, and general upkeep are frequent in Panama’s humid tropical climate
HOA fees: Particularly relevant for condominiums in gated communities or high-rise buildings
Professional accounting or tax filing fees if required by your home country
Tax environment: Panama’s tax system is genuinely favorable for foreign investors. The country applies a territorial tax system, meaning foreign-source income is not taxed locally. However, rental income from Panama properties is subject to local income tax, and there are municipal property taxes to account for. Reviewing the tax impact on yields before purchase can reveal legitimate structures that improve net returns, including certain exemption programs tied to new construction.
Occupancy and vacancy realities: Average occupancy rates in Panama’s main rental corridors vary considerably. Short-term rental markets, driven partly by tourism in areas like Casco Viejo, can produce strong income during peak season but face real vacancy risk during slower months. Long-term rentals in professional neighborhoods like El Cangrejo or Bella Vista tend to show more stable occupancy but may carry lower monthly rents.
“Vacancy is not a worst-case scenario to plan for. It is a normal operating cost that belongs in every investor’s yield model from day one.”
Liquidity considerations: Panama’s real estate market offers relatively good liquidity compared to other Latin American markets, but it is not instant. Passive income strategies that combine strong net yield with properties in high-demand neighborhoods tend to offer better liquidity when and if you decide to exit. A property that is hard to rent is also usually hard to sell.
Pro Tip: Model your investment with a conservative 8% annual vacancy rate. If the net yield still looks attractive at that assumption, the investment has real margin of safety.
How Panama’s real estate market cycle changes yield potential
Understanding foundational yield calculations and influencing factors, let’s look at how Panama’s market cycles shape investment outcomes. Market cycles matter because rental demand, property values, and transaction conditions all shift over time, and they affect the return you can realistically expect.

Recent data tells a sobering story about Panama’s residential sales market. Panama’s residential sales declined sharply, with 4,020 homes sold in 2025 compared to 7,687 in 2023 and 6,126 in 2024. Credit conditions and rising ownership costs weakened purchasing power across the market. This is significant for yield investors for two reasons.
First, when fewer people can afford to buy, rental demand typically increases. More people staying in the rental market means better occupancy rates for well-located properties. Second, slower sales activity can suppress capital appreciation in the near term, making current yield income the primary return driver rather than price growth.
Key steps for analyzing Panama’s market cycle:
Track transaction volumes quarterly to understand whether demand is shifting from buying to renting
Monitor interest rate conditions affecting local mortgage availability
Compare Panama’s cycle position to regional yield comparisons across Latin America
Identify which neighborhoods show resilient rental demand even during slower sales periods
Evaluate how new construction pipelines affect future rental supply in your target area
Panama vs. regional alternatives:
Market | Gross yield range | Market stability | Dollarized economy |
Panama City | 6.5% to 7.5% | High | Yes |
San José, Costa Rica | 5.0% to 6.5% | Moderate | No |
Bogotá, Colombia | 5.5% to 7.0% | Moderate | No |
Lima, Peru | 5.0% to 6.0% | Moderate | No |
Panama’s dollarized economy is a genuine structural advantage that eliminates currency risk entirely for US-based investors. Understanding Panama’s market outlook within this regional context helps explain why international investors continue to prioritize the country despite a sales slowdown.
The slowdown also creates a buying opportunity. Motivated sellers, less competition from local buyers, and negotiable pricing can improve your entry point, which directly improves your yield calculation since a lower purchase price raises the yield percentage on the same rental income.
Staying current on neighborhood market trends is especially valuable here, because yield performance differs block by block in Panama City.
Applying yield analysis: Selecting high-return rental properties
Having seen how market trends and costs shape yields, let’s turn to actionable steps for finding and optimizing your rental investments. Knowing the theory is one thing. Building a process to apply it is where investors separate solid returns from disappointing ones.
Start with the citywide baseline. Net yield averages of approximately 4.7% net versus 7.2% gross give you the benchmark against which to evaluate any individual property. If a listing claims a 9% gross yield, ask why it exceeds the market average. Is the rent genuinely higher, or is the purchase price unusually low because of condition issues?
Property screening checklist:
What is the verified current monthly rent or comparable market rent for identical units?
What is the full annual cost structure including HOA, management, tax, insurance, and maintenance?
What is the calculated net yield at 90% occupancy (10% vacancy assumption)?
What is the net yield at 85% occupancy to stress-test the model?
How liquid is this property type and location based on recent comparable sales?
Does the building or community have a strong rental history and established tenant demand?
Neighborhood yield and risk comparison:
Neighborhood | Typical gross yield | Rental demand | Liquidity |
Marbella | 6.5% to 7.0% | High (expat/corporate) | Strong |
Casco Viejo | 7.0% to 8.0% | High (short-term) | Moderate |
San Francisco | 6.0% to 6.8% | Strong (families) | Strong |
El Cangrejo | 6.8% to 7.5% | Moderate (students/expats) | Moderate |
Costa del Este | 5.5% to 6.5% | High (corporate) | Strong |
Reviewing premium investment markets across Panama City reveals that neighborhood selection directly determines whether you land above or below that 4.7% net average. Condos for yield vs. growth analysis shows condominiums tend to outperform houses on yield metrics due to lower maintenance obligations and higher rental demand in urban corridors.
Pro Tip: Never evaluate a rental property without collecting at least three comparable rent data points from the same building or immediate vicinity. Agent-quoted rents can be aspirational. Actual rents are what fund your returns.
For investors newer to the process, a structured property buying guide walks through the legal, financial, and due diligence steps to protect your investment from the outset.
The overlooked truth: Net yield is not a guarantee
Here is something that most investment articles on Panama will not tell you directly: net yield is a model output, not a promise. Every figure you calculate before purchase is based on assumptions. What happens to your actual return when those assumptions are wrong?
Treating yield as a model input rather than a guaranteed outcome is the mindset that separates experienced investors from those who experience regret. Market shifts, unexpected cost increases, and occupancy shortfalls regularly challenge even well-modeled returns. An air conditioning system fails. A tenant leaves midlease. A neighboring building floods the market with new rental units. None of these appear in a spreadsheet built on historical averages.
The investors who build durable portfolios in Panama do three things differently. They stress-test their yield models at least two scenarios below their base case. They hold capital reserves to absorb real operating costs without panic. And they think about their Panama holdings not as a yield machine in isolation, but as part of a broader strategy that balances yield vs. appreciation insights, liquidity needs, and risk tolerance.
Panama genuinely offers strong yield potential. A well-selected property in a high-demand neighborhood can absolutely achieve net yields above 5% on a sustained basis. But the investors who achieve that consistently are the ones who did not chase the highest gross yield number. They chose a sound net yield with defensible assumptions, not the flashiest headline figure.
True diversification in Panama real estate means holding properties across different yield profiles, not just stacking the highest advertised returns. Some properties deliver strong current income. Others provide appreciation upside and better liquidity. A balanced approach builds wealth more reliably than optimizing for any single metric.
Take your next step: Expert guidance for Panama investment
Understanding yield math is the foundation of smart investing in Panama. But applying it to real listings, real neighborhoods, and real market conditions is where most international investors benefit from working with someone who knows the ground well.

At Panama Investors, Luca Piva and his team specialize in connecting international buyers with properties that make sense on a net yield basis, not just a marketing brochure. With over 12 years of on-the-ground experience, access to exclusive listings, and personalized yield analysis for each client’s portfolio goals, the advisory process removes the guesswork that costs investors real money. If you are ready to move from theory to a specific investment plan, schedule a strategy call and get a personalized view of what Panama’s market looks like for your budget, risk profile, and return expectations.
Frequently asked questions
What is considered a competitive net rental yield in Panama?
Competitive net yields in Panama range from 4.0% to 5.0% depending on property type, location, and recurring costs, with a citywide net average of approximately 4.7% serving as a useful benchmark for comparing individual listings.
How do vacancy rates affect net rental yields in Panama?
Vacancy periods directly reduce net yields by increasing effective ownership costs relative to income earned, which is why underwriting should include a realistic vacancy assumption of 8% to 10% in any serious yield model.
Should I prioritize high yield or property appreciation when investing in Panama?
Balanced portfolios benefit from mixing yield-focused and appreciation-focused properties, particularly given that declining residential sales in Panama can shift which return driver dominates in any given market cycle.
Are property management fees significant for international investors in Panama?
Yes, property management is a core cost that typically runs 8% to 12% of monthly rental income and must be included in all yield modeling, as net yield calculations require subtracting management fees alongside insurance, maintenance, taxes, and vacancy to reflect actual investor returns.
Recommended
