
How to Monitor Real Estate Market Shifts in 2026
How to Monitor Real Estate Market Shifts in 2026
Monitoring real estate market shifts means tracking a combination of supply-demand flow indicators and leading economic signals to identify genuine momentum before price changes confirm it. Investors who rely solely on median list prices are already behind. The real edge comes from reading pending sales, new listings, days on market (DOM), and building permits together as a system. In emerging markets like Panama, where data fragmentation is common, this multi-signal approach separates disciplined investors from those reacting to yesterday’s news. Panamainvestors applies exactly this framework to help international buyers find opportunities before they become obvious.
How to monitor real estate market shifts with the right metrics
Market momentum analysis is the recognized industry term for what most investors call “tracking market shifts.” The distinction matters because momentum analysis requires measuring rates of change, not just current values. A dashboard of 5 to 7 key monthly metrics gives you a dynamic picture that no single number can provide.
The most telling metrics are:
- Median list prices signal broad pricing direction but lag actual transactions by weeks.
- Active inventory and months of supply define the supply-demand balance. Below 3 months favors sellers; above 6 months favors buyers.
- Days on market (DOM) measures buyer urgency. A falling DOM confirms demand is absorbing supply faster than sellers can replenish it.
- Percentage of price reductions reveals seller confidence. In May 2026, 17.5% of active listings had price cuts, signaling softening seller leverage even as pending sales rose 4.3% year-over-year.
- Pending sales volume is the single most reliable leading indicator. Pending contracts precede closed sales by 30 to 60 days, giving you a forward window on where prices are heading.
The 4.3% year-over-year rise in pending sales through May 2026 marked six consecutive months of growth. That kind of sustained directional move in pending volume is a stronger buy signal than any single month’s median price.
Pro Tip: Apply a 4-week rolling average to weekly data points. This smooths out holiday disruptions and reporting variances, making genuine trend shifts visible without the noise.
Tracking these metrics in isolation is a mistake. The power is in reading them together. Rising DOM alongside rising prices, for example, signals a market in transition rather than a healthy seller’s market. That combination demands closer scrutiny, not a confident buy decision.
What leading economic indicators reveal before prices move
Building permits, mortgage applications, and job openings are the three leading indicators that consistently signal real estate market direction up to 6 months before price changes appear in closed sales data. Traditional price reports are lagging by definition. By the time the S&P CoreLogic Case-Shiller index reflects a shift, the best entry points are often gone.
Here is how each indicator works in practice:
- Building permits lead housing starts by roughly 6 months. A surge in permit activity in a specific submarket tells you new supply is coming. In Panama City’s Casco Viejo district, tracking municipal permit filings has historically given investors a 5 to 7 month window before new inventory hits the market.
- Mortgage loan applications lead home sales by 1 to 3 months. The Mortgage Bankers Association’s Weekly Applications Survey is publicly available and updated every Wednesday. A sustained 10% or greater rise in purchase applications over 4 to 6 weeks is a reliable demand signal.
- Job openings and labor market data reflect buyer purchasing power. In markets where a single employer or sector dominates, a major hiring announcement can shift demand within a quarter. Panama’s logistics and financial services sectors function exactly this way.
Combining these leading indicators with the flow metrics from Section 2 sharpens your timing considerably. Investors who monitor flow indicators like the gap between new listings and pending contracts gain a 1 to 3 month lead time on price adjustments compared to those watching median prices alone.
Pro Tip: Set calendar alerts for the first Wednesday of each month when the Mortgage Bankers Association releases its applications data. Pair that reading with your local new listings count from the same week for a fast, two-point demand check.
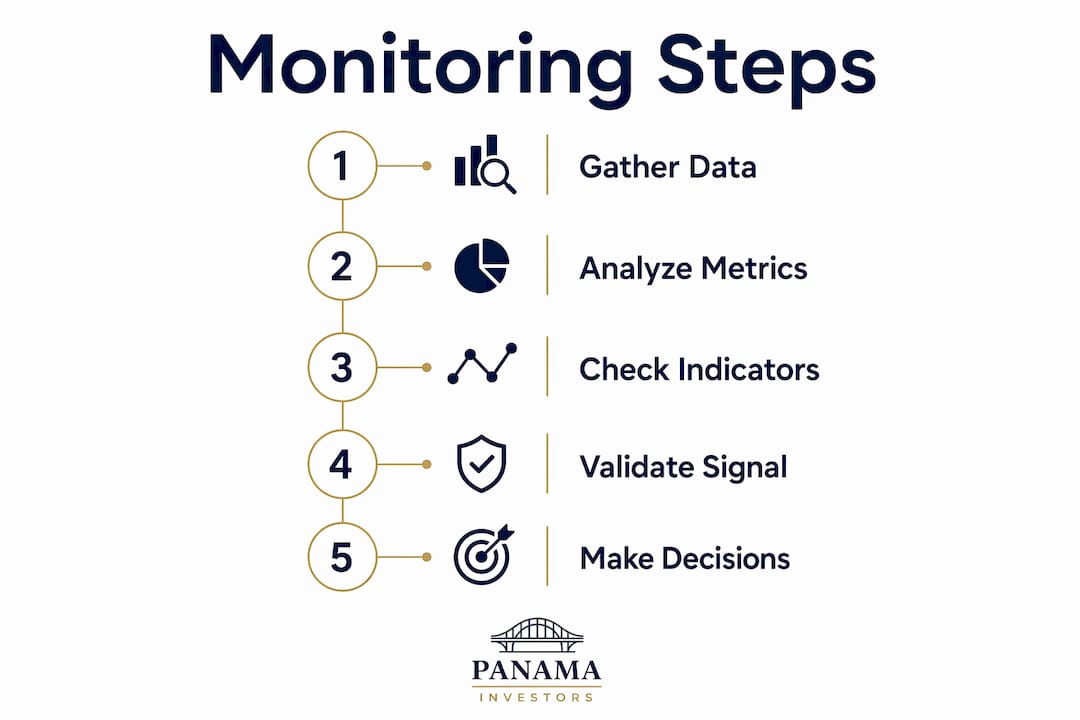
The critical discipline here is not to act on any single leading indicator. Permit activity rising while mortgage applications fall is a contradiction that requires explanation before you commit capital.
Which analytic methods best validate a market shift signal
Confirming a suspected shift requires more than eyeballing a trend line. Real estate market analysis techniques that produce defensible conclusions rely on four core methods, each with distinct strengths.

| Method | What it measures | Best used for |
|---|---|---|
| Paired sales analysis | Price change between two sales of the same property | Isolating time-based appreciation with minimal noise |
| Assessment ratio analysis | Implied market value vs. assessed value | Cross-jurisdictional comparisons and detecting assessment lag |
| Regression modeling | Price as a function of multiple variables | Markets with sufficient transaction volume (50+ sales) |
| Market trend indexing | Price movement indexed to a base period | Long-run trend visualization using S&P CoreLogic Case-Shiller or local MLS data |
Paired sales and regression modeling, when combined with the S&P CoreLogic Case-Shiller index and local MLS data, produce the most defensible time adjustments for valuations. This combination is the standard in professional appraisal practice and should be the standard for serious investors too.
Assessment ratio analysis deserves special attention. Assessment ratios range from 10% to 100% depending on jurisdiction. Calculating the implied market value from a known assessment ratio lets you normalize tax data for cross-market comparison. A deviation of more than 10 to 15% year-over-year in implied market value is a red flag worth investigating. That said, tax assessments are lagging indicators capped by formula-based mass appraisals. Never use assessed value as a price anchor. Use it as a cross-check against recent closed sales.
Graphical tools matter too. Scatter plots of sale price versus time reveal pricing trajectories and outliers that tables miss. Line graphs of DOM over 12 to 24 months expose seasonality patterns that would otherwise look like trend signals. Visualizing data before modeling it prevents the most common analytical error: fitting a model to noise.
How to avoid misreading market data and conflicting signals
Data quality problems are the leading cause of bad investment decisions in low-volume and emerging markets. Small sample sizes and outliers distort trend perception faster than most investors realize, particularly in niche property types or newly developing neighborhoods.
The most dangerous misread is treating a transitional market as a directional one. Conflicting signals such as rising median list prices alongside increasing DOM indicate a market in flux, not a confirmed bull or bear trend. Acting on either signal alone in that environment is a mistake.
Best practices to protect your analysis:
- Confirm two-sided momentum. Simultaneous increases in both new listings and pending sales across the top 50 metros distinguish genuine market shifts from seasonal noise. If only one side is moving, wait for confirmation.
- Define neighborhood boundaries precisely. Align boundaries with school districts, physical barriers, or zoning lines. Mixing properties from different micro-markets inflates variance and hides real trends.
- Exclude distress sales from trend calculations. Foreclosures and short sales transact at discounts that have nothing to do with market momentum. Including them skews your median and your regression.
- Increase monitoring frequency during transitions. Experts recommend shifting to bi-weekly reviews rather than monthly when conflicting signals appear. Two extra data points per month can clarify whether a trend is forming or reversing.
Pro Tip: When you see free property data showing a strong trend in a low-volume market, check the sample size first. Fewer than 15 to 20 transactions in a 90-day window is too thin to support a directional conclusion.
The discipline of defining what counts as a valid signal before you start analyzing protects you from confirmation bias. Write down your criteria in advance. If a market needs 20 or more closed sales per quarter to produce reliable trend data, hold to that threshold even when a deal looks attractive.
What best practices apply when monitoring emerging real estate markets
Emerging markets require a different monitoring posture than established ones. Static snapshots of median prices tell you almost nothing in a market where transaction volume is thin and data suppression is common. The priority is dynamic data flows over point-in-time readings.
Practical adjustments for emerging market monitoring include:
- Prioritize qualitative intelligence alongside quantitative data. Local brokerage reports, conversations with property managers, and community economic news fill the gaps that MLS data leaves in fragmented markets. In Panama, Luca Piva’s network at Panamainvestors provides exactly this kind of ground-level signal that no dashboard can replicate.
- Build a unified monitoring dashboard. Integrate regional MLS data, permit filings, mortgage application trends, and local economic indicators into a single view. Reviewing them in isolation creates blind spots.
- Adjust for data suppression thresholds. Many MLS systems suppress data when fewer than 3 to 5 sales occur in a category. Recognize when you are seeing suppressed data and widen your geographic or property-type boundary to get a usable sample.
- Reassess boundaries and price bands quarterly. Emerging markets shift faster than established ones. A neighborhood boundary or price band that was accurate 6 months ago may already be obsolete.
Building custom real estate strategies around these principles means your monitoring system evolves with the market rather than lagging it. The investors who outperform in emerging markets are not the ones with the most data. They are the ones whose data systems adapt fastest.
Pro Tip: Set a quarterly calendar review to update your neighborhood boundary definitions and price band thresholds. Markets that are growing quickly will outgrow your original parameters within two to three quarters.
Key takeaways
Effective monitoring of real estate market shifts requires combining leading economic indicators with real-time flow metrics, validated through multiple analytic methods, and adjusted for the specific data conditions of your target market.
| Point | Details |
|---|---|
| Use flow metrics, not just prices | Pending sales and new listings reveal momentum 1 to 3 months before closed price data confirms it. |
| Apply rolling averages | A 4-week rolling average removes noise and makes genuine trend signals visible in volatile markets. |
| Confirm two-sided momentum | Genuine shifts show simultaneous rises in both new listings and pending sales, not movement in just one. |
| Validate with multiple methods | Paired sales, regression modeling, and assessment ratio analysis together produce defensible conclusions. |
| Increase frequency during transitions | Shift from monthly to bi-weekly monitoring when conflicting signals appear to catch emerging trends faster. |
Why I trust process over instinct when markets get confusing
The most common mistake I see investors make is doubling down on a single metric when the market sends mixed signals. Rising prices feel bullish. But if DOM is climbing at the same time, that is not a bull market. That is a market where sellers have not yet accepted that buyers have more options. Those two signals together tell a more honest story than either one alone.
What I have found after working in markets where data is thin and fragmented is that the process matters more than any individual data point. When I commit to reviewing a fixed set of indicators on a fixed schedule, I catch transitions earlier and I avoid the emotional pull of a single impressive number. The discipline of the system is the edge.
Local intelligence is irreplaceable in emerging markets. No dashboard tells you that a major employer is relocating, that a new transit line is being planned, or that a specific neighborhood is attracting a wave of foreign buyers. Those signals come from relationships. The value of a local agent in a market like Panama is not just access to listings. It is access to the qualitative layer that quantitative tools cannot capture.
The investors I respect most are the ones who treat their monitoring system as a living document. They update their boundaries, recalibrate their thresholds, and add new indicators when the market evolves. That adaptability is what separates consistent performers from one-cycle winners.
— Roie
Put your market monitoring to work with Panamainvestors

Knowing how to read market signals is one thing. Having a system that applies them to a specific market with real investment potential is another. Panamainvestors combines data-driven market analysis with on-the-ground expertise in Panama’s real estate market, one of the most consistently appreciating emerging markets in Latin America. Luca Piva and the Panamainvestors team provide clients with tailored monitoring frameworks, frequent market updates, and personalized strategy development built around the investment property factors that drive real returns. If you are ready to move from monitoring to acting, book a strategy call and get a market analysis built around your specific investment goals.
FAQ
What is the most reliable leading indicator for real estate market shifts?
Pending sales volume is the strongest single leading indicator, preceding closed sales by 30 to 60 days. Combining pending sales with mortgage application trends extends that forward window to 1 to 3 months.
How often should I review market data when tracking housing market fluctuations?
Monthly reviews are sufficient in stable markets. During transitional periods when conflicting signals appear, shifting to bi-weekly monitoring provides the clarity needed to distinguish forming trends from reversals.
Why are median list prices insufficient for assessing property value changes?
Median list prices reflect asking behavior, not transaction behavior, and lag actual market activity by weeks. Flow metrics like pending sales and new listings capture momentum earlier and more accurately.
How do I confirm a genuine market shift versus seasonal noise?
Two-sided momentum is the key test. A genuine shift shows simultaneous increases in both new listings and pending sales. Movement in only one direction is more likely seasonal or temporary.
What tools help interpret market data for real estate in emerging markets?
Unified dashboards combining MLS data, permit filings, and local economic indicators provide the most complete picture. Pair these with qualitative intelligence from local brokers to account for data gaps common in fragmented markets.
